The VES-Matic 5 system: performance of a novel instrument for measurin erythrocyte sedimentation rate
Piva E., Stoppa A., Pelloso M., Plebani M.
Clinical Chemistry and Laboratory Medicine, 2022
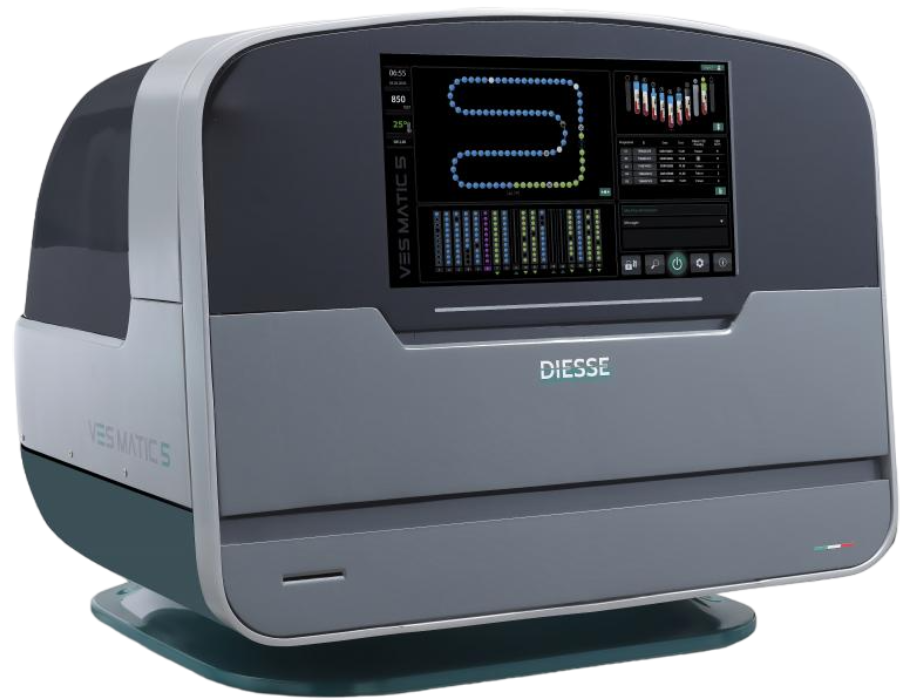
The erythrocyte sedimentation rate (ESR) was applied in clinical practice following the studies by Edmund Biernacki in the 19th century, even though the test was standardized many years later by another scientist, Alf Vilhelm Albertsson Westergren [1]. Since its discovery, ESR is the laboratory test that quantifies a complex biological phenomenon, i.e., the behavior of a suspension of red blood cells in plasma under specified conditions. ESR is not linear and plotted against time; the sedimentation shows a sigmoid curve. Three phases are known. The first is the “lag phase” in which erythrocytes form rouleaux and aggregates and the sedimentation is very slow. The second, or “decantation phase,” is the true sedimentation phase. Erythrocytes fall more rapidly because the plasma interface and the sedimentation can occur more rapidly. In the final phase, erythrocyte aggregates pile up on the bottom of the tube. New technologies and technical advances allow automated instruments to perform ESR testing, in consolidation with the modern organization of clinical laboratories. Automated instruments have great advantages like safety for operators, reduced turn-around time, and better analytic precision. Some of these instruments use the sedimentation principle by selecting an appropriate time interval, while others use other innovative techniques, which are different from the sedimentation rate. For a long time, the International Council for Standardization in Haematology (ICSH) advocated ESR standardization and harmonization. The last document, published in 2017, was an obvious need to evaluate the different automated methodologies and all the working methods against that of the reference, that is the Westergren method. The recommendations were established to document the reliability, accuracy, and robustness of the results against the Westergren method for all new instruments, both for those based on the modified sedimentation principle and those that use different techniques. Recently, a novel fully automated system, the VES-Matic 5 (DIESSE Diagnostica Senese, Monteriggioni Siena, Italy), has been proposed for ESR determination. Using closed ethylenediamine tetraacetic acid (EDTA) tubes and with a complete automation process, the instrument evaluates the sedimentation of the red cells and using a mathematical algorithm converts the raw data obtained into ESR results. The instrument also uses artificial intelligence (AI) to detect pre-analytical errors, for example, coagulated or unfilled samples. The aim of the present study was to perform the analytical validation of this new automated analyzer for ESR testing, in agreement with ICSH recommendations.
The automated analyzer for ESR determination, Ves-Matic 5 was evaluated at the Department of Laboratory Medicine, University-Hospital of Padua according to the ICSH recommendations and included method comparison, precision study (intra-run and inter-run), hemolysis, triglycerides (TGs), and anemia interference studies, sensitivity to fibrinogen, and verification of reference ranges.
Blood samples, used for method evaluation, precision determination, sensitivity to fibrinogen, and assessment of the interferences as well as verification of reference ranges, were selected from the daily routine. Samples were leftovers that had an initial request for cell blood counter (CBC) and/or ESR of both hospitalized patients and outpatients admitted to the Padua University Hospital. All samples were collected in 3.0 mL bi-potassium EDTA (K2-EDTA) BD Vacutainer® blood collection tubes (Becton Dickinson, BD-Plymouth, UK), processed according to manufacturers’ specifications, and analyzed within 5 h from venipuncture. The study followed the ethical principles for medical research involving human subjects, according to the World Medical Association (WMA) Declaration of Helsinki, and under the terms of all relevant local legislation.
The new automatic instrument for the determination of the ESR, the VES-Matic 5 is based on a modified Westergren sedimentation technique. Briefly, all samples are collected in an EDTA anticoagulated tube, loaded into the instrument on the same rack of the CBC instruments, samples are mixed, and under controlled temperature evaluated for sedimentation measurement using an optoelectronic light source. The sedimentation rate is evaluated by a large number of optical recordings during a 20 min period and the differences are evaluated. Raw data are corrected for temperature variations and the obtained results are converted to Westergren values using a mathematical algorithm. The first result is performed after 28 min. Technologically innovative, the new analyzer applies an AI system in recognition of lipemic, hemolyzed, coagulated, or mislabeled samples, while the Internet of things, through an internal camera, is used for advanced remote assistance. In this way, the analyzer is connected directly to diagnostic devices, reporting any malfunction directly and receiving instructions for self-repair, where possible. The throughput is 190 samples per hour, and walk away mode and continuous loading are supported.
According to ICSH recommendations, ESR by the Westergren method was performed using a diluted sample and circular glass Westergren tube with an inner diameter of 2.55 mm. Briefly, the EDTA-anticoagulated blood was thoroughly mixed by complete inversion of the tube 20 times and diluted 4:1 using a trisodium citrate dihydrate solution (3.8 %). The Westergren tube was allowed to stand for 60 min in an appropriate supporting rack in a stable, vertical position in a fume hood, at constant temperature (20–25 °C) and free from external influences such as vibrations, heat, and direct sunlight. The sedimentation rate was read by visual determination after 60 min as the distance from the top of the plasma level to the top of the Red Blood Cell (RBC) layer and recorded in mm/h. All Westergren analyses were performed by a single analyst to minimize pipetting and reading variations. The comparison study against the gold standard method was made on the same working day within 5 h of blood sampling.
Samples of 132 females and 139 males (a total of 271)
were selected among those over the age of 18 years
[(median age 58, interquartile ranges (IQR): 42.25–
70.75 years], spanning the entire ESR analytical range
(from 2 to 120 mm), and with hematocrit value ≥ 0.35
L/L [0.41 ± 0.03 L/L, mean ± SD; 95 % confidence
interval (CI): 0.406–0.414). Hematocrit was determined
as part of the complete blood count on Sysmex XN 10
automated hematology analyzer (Sysmex Corporation,
Kobe, Japan).
Undiluted EDTA samples were used first for the
determination of ESR by VES-Matic 5, then the EDTA
anticoagulated sample was diluted manually with 3.8 %
citrate solution in a ratio of 4:1, according to the ICSH
recommendations for the Westergren method. Following
the ICSH recommendations, method comparisons were
further assessed in three subgroups, according to the
ESR values obtained with the Westergren method, that is,
low (< 20 mm), middle (20–60 mm), and upper third
(> 60 mm) of the analytical range.
Intra-run precision was estimated using 10 routine patient samples with ESR values covering the analytical range from 2 to 140 mm. All samples were analyzed on VES-Matic 5 for five replicates. Inter-run precision was performed using commercial quality control (QC) samples in the normal and abnormal range. Specifically, inter-run precision on VES-Matic 5 was assessed using two lots of the control material, the ESR Control Cube, composed of stabilized human blood at two levels for normal and abnormal values. For evaluation of the inter-run precision, controls were used three times a day on five consecutive days.
Intra-run precision was estimated using 10 routine patient samples with ESR values covering the analytical range from 2 to 140 mm. All samples were analyzed on VES-Matic 5 for five replicates. Inter-run precision was performed using commercial quality control (QC) samples in the normal and abnormal range. Specifically, inter-run precision on VES-Matic 5 was assessed using two lots of the control material, the ESR Control Cube, composed of stabilized human blood at two levels for normal and abnormal values. For evaluation of the inter-run precision, controls were used three times a day on five consecutive days.
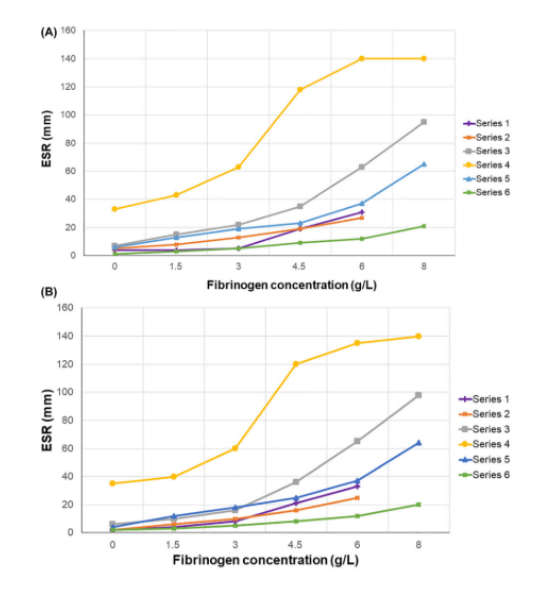
According to ICSH recommendations, the sensitivity of response to added fibrinogen was assessed in six healthy volunteers (3 females and 3 males) recruited from the laboratory staff. Human fibrinogen (Sigma-Aldrich, St Louis, MO, USA, expected concentration 20 g/L) was dissolved at 37 °C in 0.9% saline solution, and sterile-filtered using a 0.22 μm filter (Merck Millipore Ltd., County Cork, Ireland), as recommended by the manufacturer. Fibrinogen concentration obtained in stock solution was 14.8 g/L, measured using the automated Clauss method (Sysmex CS-5100, Sysmex Corporation, Kobe, Japan). Samples were prepared, with the addition of saline solution alone, or saline spiked with stock fibrinogen to reach concentrations of: 1.5, 3, 4.5, 6, and 8 g/L and added to each tube. ESR was determined first on the VES-Matic 5 analyzer and then by the original Westergren method. The baseline fibrinogen concentration (normal range 1.5–4.5 g/L) of six volunteers (shown as series in Figure 2), measured by the Clauss method, was the following: series 1: 1.9 g/L; series 2: 2.7 g/L; series 3: 2.7 g/L; series 4: 4.1 g/L; series 5: 2.4 g/L; series 6: 2.2 g/L. The sensitivity for fibrinogen in four of the volunteers was assessed to reach the concentration of 8 g/L.
Twenty-eight routine patient samples, covering the whole ESR range, were selected for a hemolysis interference study. At first, ESR was determined by VES-Matic 5 analyzer and later hemolysis was induced in vitro by the addition of 50 μL of lysing solution (Osmored, Eurospital Spa, Trieste, Italy). To eliminate the dilution effect, 50 μL of blood was withdrawn from each tube before the addition of lysing solution. Hemolyzed samples were analyzed using the VES-Matic 5 and then by the Westergren method. Hemolysis index (HI) was determined on Architect c8000 (Abbott Laboratories, Abbott Park, IL, USA), which uses a spectrophotometric method incorporating four wavelength pairs and predefined constants to report numeric H-index into plasma-free hemoglobin results.
TGs interference was evaluated in three routine patient samples, each with the following different values of ESR: 7, 32, and 138 mm/h, respectively. To evaluate interferences, a solution of TGs from a human plasma TG fraction (Lee Biosolutions, Maryland Heights, MO, USA, lot number W105417) was made, reaching a final concentration of 360 mg/dL (4.06 mmol/L) (Cobas Modular 8000, Roche Diagnostics S.p.A, Monza, Italy). Using the VES-Matic 5, ESR was evaluated first in each sample; then, aliquots of 150 μL of TG solution (0.61 mmol/L) were added three times, reaching the final addition of 450 μL of TG solution (1.83 mmol/L).
Anemia interferences were evaluated in 141 routine patient samples, spanning the entire ESR analytical range (from 4 to 140 mm) and selected based on hemoglobin values (< 109 g/L) and hematocrit values (< 0.34 L/L) (Sysmex XN‐10, Sysmex Corporation, Kobe, Japan). ESR was first evaluated by the VES-Matic 5 analyzer and then using the Westergren reference method.
Reference ranges were verified according to the CLSI EP28-A3C document. For transferability assessment ESR was determined both using VES-Matic 5 and the Westergren method in a total of 311 samples (163 healthy males and 148 healthy females, aged from 18 to 94 years). Samples were from routine outpatients that required a CBC, without the collection of additional test tubes for this study. Information such as food in the past 24 h, alcohol consumption, lifestyle, and health status was investigated at the time of collection. Results of the required laboratory tests were then verified. Samples were used for age and gender-related reference interval groups. Due to the difficulty of recruiting pediatric samples, only gender, and age-specific adult reference ranges were verified in this study, divided by age into three groups: from 18 to 50 years, 50–70 years, and older than 70 years. The statistical significance was calculated at 95 % of the reference interval. The following reference ranges were applied: under 50 years: 15 mm for males, and 20 for females; over 50 and below 70 years: < 20 mm for males and < 30 mm for females. Additional upper limits for people over 70 years old, were < 30 mm for males and < 35 for females. The ranges chosen for verification of the reference ranges obtained in this study are the most common given in the literature and the H02-A5 CLSI document.
The comparison of the VES-Matic 5 against the reference method was evaluated by calculating bias and limits of agreement using Bland–Altman analysis. Linear regression was carried out using Passing–Bablok regression to estimate constant and/or proportional difference, and Spearman’s rank correlation coefficient (ρ) was calculated to assess the strength and direction of the association between the compared data. Mean and median values, standard deviations (SD), and IQRs (25th and 75th quartiles) were also reported. For the precision study, Coefficients of variation (CVs), mean values, SD, and confidence intervals (CI) at 95 % were calculated. For the evaluation of interferences, a paired sample t-test and Wilcoxon signed-rank test were used for the comparison of groups. The D’Agostino–Pearson test was used to assess data distribution normality. One-way analysis of variance (ANOVA) test was used to evaluate interference studies. Statistical analysis was performed with MedCalc Statistical Software version 19.1 (MedCalc Software bv, Ostend, Belgium; https://www. medcalc.org; 2019). Precision and verification of reference ranges were performed with Analyse-it for Microsoft Excel software, release version 5.92 (Analyse-it Software, Ltd., Leeds, LS3 1HS, United Kingdom).
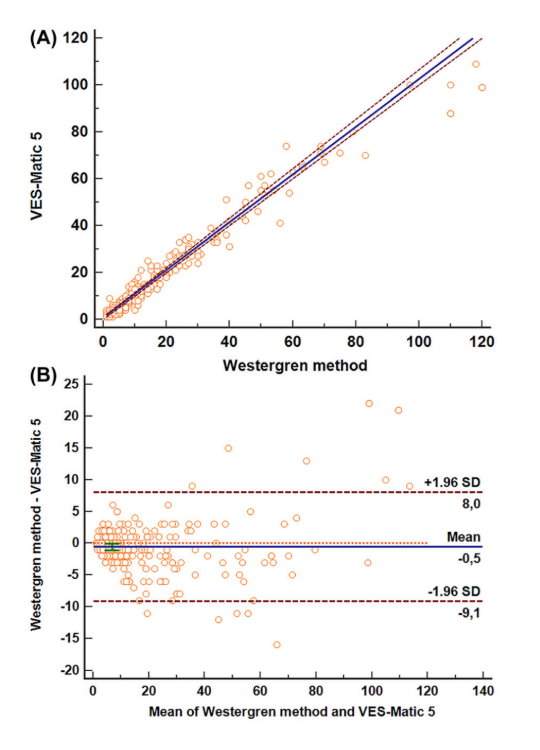
The mean ESR values obtained were 18.81 mm (95 % CI: 16.27–21.36 mm) for the VES-Matic 5 and 18.25 mm (95% CI: 15.55–20.95 mm) for the gold standard Westergren method. The median ESR values were 11 mm (IQR: 5– 23.75 mm) using VES-Matic 5 and 9 mm (IQR: 5–22.75 mm) with the Westergren method. The comparison of methods by Passing–Bablok analysis has shown a good agreement without systematic or proportional differences. The regression equation was y=−0.646 (95 % CI: −1.00 to 0.11) + 0.979 (95 % CI: 0.944–1.00)x (Figure below). The mean bias of −0.542 (95 % CI: −1.06 to −0.01) was obtained by Bland–Altman analysis; the value of 8.03 for the upper limit and −9.11 for the lower limit can be considered acceptable limits, implicating a non-significant bias based on clinical criterion (Figure below). The Spearman’s coefficient of rank correlation (ρ) was 0.963, with its 95 % CI from 0.953 to 0.971. The study comparison was also performed for the subgroups of results, based on the analytical interval, i.e., for the low (< 20 mm), middle (20–60 mm), and upper range (> 60 mm) of values and are presented in Table 1.
| Equation | Intercept (95 % CI) | Slope (95 % CI) | ρ (95 % CI) | Mean bias (95 % CI) | |
|---|---|---|---|---|---|
| Low (n = 190) | y= 0.0 + 1.0x | 0 (– 0.33 to 0.0) | 1.0 (1.0 – 1.11) | 0.899 (0.868 – 0.923) | –0.51 (–0.80 to –0.22) |
| Medium (n = 61) | y= 5.16 + 0.92x | 5.16 (2.0 – 8.0) | 0.92 (0.80 – 1.0) | 0.885 (0.815 – 0.930) | –2.03 (–3.30 to –0.77) |
| High (n = 20) | y= 27.7 + 0.60x | 27.7 (15.8 – 36.49) | 0.60 (0.49 – 0.78) | 0.865 (0.685 to 0.946) | 3.4 (–1.99 to 8.79) |
Passing–Bablok regression analysis, Spearman’s rank correlation coefficient, and Bland–Altman analysis results were reported for each subgroup. For the low and middle range ESR values, the mean bias obtained by the Bland–Altman analysis can be considered acceptable from a clinical point of view.
In Table 2 the results of the intra-run precision study are presented, spanning a full range of values. ESR results are reported as mean value, 95 % CI for the mean, SD, CV%, and the minimum and maximum values obtained. Five replicate measurements of the specimens showed a good level of precision that was below 10 % (CV < 10 %), except for two specimens, one with very low results, another one with a value of 11.2 mm, and a CV of 11.64 %. In Table 3 the inter-run precision is reported. The evaluation was determined with two different lots of QC material, both in the normal and abnormal range, analyzed three times on five consecutive days. Inter-run precision was below 11 % (CV 10.9 %) for the normal level and < 3 % (CV 2.7 %) for abnormal level. The Grubbs’ test did not reveal any outliers.
| Samples | n | Mean, mm | 95 % CI | SD, ± | CV, % | Minimum, mm | Maximum, mm |
|---|---|---|---|---|---|---|---|
| 1 | 5 | 3.2 | 2.16–4.24 | 0.45 | 26.15 | 2 | 4 |
| 2 | 5 | 6.8 | 6.24–7.35 | 0.45 | 6.60 | 6 | 7 |
| 3 | 5 | 11.2 | 9.58–12.82 | 1.30 | 11.64 | 9 | 12 |
| 4 | 5 | 16 | 15.12–16.88 | 0.77 | 4.42 | 15 | 17 |
| 5 | 5 | 31.8 | 30.76–32.84 | 0.84 | 2.63 | 31 | 33 |
| 6 | 5 | 44 | 39.88–48.12 | 3.32 | 7.53 | 41 | 49 |
| 7 | 5 | 52.8 | 49.58–56.01 | 2.59 | 4.90 | 49 | 56 |
| 8 | 5 | 91.4 | 88.28–94.52 | 2.51 | 2.75 | 87 | 93 |
| 9 | 5 | 97.8 | 93.46–102.14 | 3.49 | 3.57 | 92 | 101 |
| 10 | 5 | 138 | 132.45–143.55 | 4.47 | 3.24 | 130 | 104 |
| Control | Lot | Days | Mean, mm | SD, ± | CV, % |
|---|---|---|---|---|---|
| Normal | 720 | 5 | 6.5 | 0.7 | 10.9 |
| Abnormal | 720 | 5 | 37.2 | 1.0 | 2.7 |
The sensitivity to increasing amounts of fibrinogen was determined and an excellent similar sensitivity was obtained both with the VES-Matic 5 and the Westergren reference method (Figure below). The assessment of the linearity of response between methods and the sensitivity was evaluated using the Bland–Altman statistical method, and no significant bias was observed (arithmetic mean: −0.7353; 95 % CI from −1.547 to 0.0765; p = 0.0743, NS). Calculation of the correlation coefficient (r = 0.998, 95 % CI from 0.996 to 0.999) and the slope (0.993, 95 % CI from 0.971 to 1.014) gives an excellent assessment of response to fibrinogen of VES-Matic 5. The most significant rise of ESR related to increasing concentrations was observed for both methods at the final added fibrinogen concentration of 6 and 8 g/L. The highest ESR elevation was six and 9.47 times the baseline (mean value from 8.5 mm/h to 51.2 and 80.5 mm/h) for the Westergren method, while ESR elevation was 5.6 and 8.64 times the baseline (mean value from 9.3 mm/h to 51.67 and 80.3 mm/h) for the VES-Matic 5.
The results of the assessment of hemolysis interference were evaluated by the Bland–Altman method, and the mean of the differences was not significant (bias: 0.036, 95 % CI from −22,896 to 2,3610). The results of the ANOVA test showed that the mean values of the subgroups did not differ significantly (p = 0.972, NS) demonstrating that there are no hemolysis effects on ESR determination using VES-Matic 5. The median HI value was 5.2 g/L (ranging from 0.9 to 6.7 g/L of free hemoglobin).
For the VES-Matic 5, the assessment of TGs interference on ESR determination was evaluated by ANOVA test, and the values obtained for the three samples did not differ significantly (p = 1.00, not significant, NS), demonstrating that there are no significant effects on the ESR results due to the increase of TG concentration. The baseline values compared to those obtained in samples with the final concentration of 162 mg/dL of TGs were respectively: from 6 to 8 mm/h; from 41 to 30 mm/h; from 120 to 140 mm/h.
To evaluate potential anemia interference, samples
selected had hemoglobin values from 72 to 109 g/L (mean
value: 96.82 ± 8.25 g/L, 95 % CI from 95.72 to 97.93)
and hematocrit values from 0.21 to 0.34 L/L (mean
value: 0.297 ± 0.27 L/L, 95 % CI from 0.29 to 0.30).
The mean ESR value obtained by VES-Matic 5 was
57.11 ± 44.21 mm (95 % CI: from 49.75 to 64.47 mm) while
the mean ESR with the gold standard Westergren method
was 49.53 ± 41.11 mm/h (95 % CI: from 42.69
to 56.38 mm).
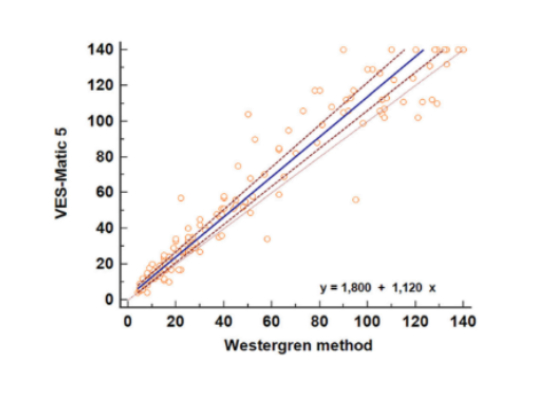
The regression equation y = 1.80 (95 % CI from −0.18
to 3.54) + 1.12 (95 % CI from 1.06 to 1.18)x calculated
by the Passing–Bablok regression analysis showed
a good comparison of methods, with no statistically
significant systematic differences while a minor constant
and proportional difference was found, when comparing
high values (Figure below). The cumulative test (Cusum linearity
test, p-value = 0.17) indicated linearity between methods,
while the Spearman’s coefficient of rank correlation (ρ) was
0.966 (95 % CI: from 0.953 to 0.975).
TFor each gender and age group, 95 % of the reference upper limits obtained by the VES-Matic 5 were inside those reported in Materials and Methods section, therefore making it possible to confirm the reference limits of the present study. The upper limits obtained in this study are reported in Table 4.
| Gender and age, years | n | VES-Matic 5, mm | Westergren, mm | ||
|---|---|---|---|---|---|
| Mean ± SD | Upper limit | Mean ± SD | Upper limit | ||
| Male < 50 | 52 | 6 ± 6 | 15 (11–18)a | 6 ± 6 | 14 (9–19)a |
| Male from 50 to 70 | 64 | 9 ± 7 | 19 (16–22)a | 8 ± 7 | 18 (15-21)a |
| Male > 70 | 49 | 17 ± 10 | 33 (30–37)a | 14 ± 9 | 30 (24-33)a |
| Female > 50 | 61 | 12 ± 8 | 25 (21–28)a | 11 ± 8 | 22 (18-26)a |
| Female from 50 to 70 | 43 | 14 ± 8 | 27 (23–30)a | 12 ± 7 | 24 (19-28)a |
| Female < 70 | 44 | 19 ± 11 | 37 (33–41)a | 16 ± 9 | 31 (26-35)a |
ESR is still considered an overall test to assess the acute
phase reactants, as a “sickness index” that clinicians have
used for decision-making for over 50 years, in conjunction
with the physical examination and clinical history of the
patient.
The diagnostic accuracy of ESR and C-reactive protein
in acute inflammation diseases has recently been
reassessed and has shown that ESR can provide valuable
clinical information. For example, its determination may
contribute to the management of COVID-19 patients
in the determination of disease progression. ESR continues to demonstrate its unquestioned clinical
usefulness in diagnosis, monitoring, and progression
of response to therapy of certain diseases associated
with immune response, such as rheumatoid arthritis
or systemic lupus erythematosus. In other
arthritic disorders, ESR is one of the main laboratory tests
in investigating patients presenting signs and symptoms
of temporal arteritis or polymyalgia rheumatica.
Automation of ESR testing, based on technological
improvements in studies of the sedimentation phenomenon,
has brought about the development of many automated
instruments which are now available for routine use.
It should be underlined that automation allows for workflow
optimization, increases personnel safety by using closed
systems, and shortens turnaround times. Consequently,
updated recommendations published by ICSH addressed
standardization and harmonization of the novel methods
to decrease variation in the interpretation of ESR results.
In this study, following ICSH recommendations we
evaluated the analytical performance of a new automated
ESR analyzer, the VES-Matic 5, that uses the sedimentation
principle and undiluted EDTA samples. This is an important
issue because the most suitable specimen for ESR testing
is that employed for CBC, i.e., samples anticoagulated
with EDTA that avoid the collection of a second specimen
if clinicians require both tests in the same patients.
The use of undiluted or diluted specimens represents one
of the most important testing variables. For automated
ESR determination with diluted sodium citrate blood, test
tubes are dedicated and the anticoagulated blood ratio is
different from that of the citrate tube used for coagulation
testing, which must never be used. To improve
standardization, the anticoagulant type for specimens
to use in ESR testing should be discussed again
at an international level to achieve comparable results.
The VES-Matic 5 comparison against the reference
Westergren method, assessed in the diluted specimen,
has shown excellent performance and agreement, with
better data than other previous comparison studies.For ESR very low results, equal to 3.2 mm, the intra-run
precision showed a CV % equal to 26.15; data should be
judged on clinical interpretation because the minimum
and maximum values vary from 2 to 4 mm. For other
ranges of results, the imprecision was < 10 %, except
for only one case with an ESR value of 11.2 mm, with a CV
of 11.64 %. In terms of inter-run precision, the system
provided a satisfactory and acceptable performance
that was better than those published in previous studies.As far as interferences are concerned,
the VES-Matic 5 response to each level of fibrinogen
concentration was in the agreement with Westergren,
indicating that the new instrument is interchangeable
with the gold standard method.
In hemolysis evaluation, the VES-Matic 5 did not show
significant susceptibility to hemolysis, contrary to previous
data observed using the instrument VES-Matic Cube
200, manufactured by the same company. For hemolysis
interference we operated similarly to the study reported
for the VES-Matic Cube 200, i.e., using spiking of native
samples with a lysing solution. No significant decrease
was observed for ESR values before and after lysis of the
samples and no negative effects, similar to the studies
on instruments that utilize photometric rheology
principle, achieving harmonization in this issue.
As compared to other studies, no significant decrease
in ESR values was observed in TGs interference
evaluation, but this study has some limitations because
of the small number of samples assessed, and poor
recovery of concentration of TGs.
Anemia can affect the erythrocytes sedimentation, causing
an acceleration of the global phenomenon. We evaluated
the effect of anemia by employing samples of 141 patients,
with a hemoglobin level ranging from 72 to 109 g/L,
minimizing variables that can affect the manual technique
for the Westergren method. In this study, VES-Matic 5
showed a good comparison against Westergren by statistic
Passing–Bablok regression and no significant systematic
difference was found, except for ESR high values, when
constant and proportional differences were found, clinically
not significant. Our data are in agreement with the previous
study.
ESR varies greatly with age and sex and can be influenced
by lifestyle factors (physical activity, smoking, and alcohol
consumption), and common metabolic abnormalities
(obesity and related metabolic syndrome).
Although reference values should be established locally,
many laboratories are adopting references published
in papers or books or stated by the manufacturers.In this regard, some consideration should be
made: reference ranges were published years ago when
there were variations in methodology such as different
pipettes and materials used in the Westergren method.
In an effort, to achieve maximum diagnostic efficiency
when interpreting the results of the ESR test, this issue
deserves special attention.
In this study, VES-Matic 5 showed reference ranges that
meet those obtained utilizing the Westergren method.
The preliminary upper range of the present study should
be interpreted considering undiluted samples and
a non-parametric approach, statistical method
recommended by CLSI. The highest ESR was found
in healthy subjects over 70, different in men and women,
and therefore separate values should be established
for people in this age bracket.
This study assessed the analytical validity of the VES-Matic
5 analyzer and the comparability with the gold standard
method. According to our findings, and considerating
that there are useful commercial QC and suitable
EQA materials and programs, the VES-Matic 5 can be
employed appropriately for routine purposes. Finally,
the VES-Matic 5 works using AI-based software for the
reduction of pre-analytical errors including mislabeled,
hemolyzed, or coagulated samples. Laboratory medicine
has a central role in the diagnostic workup of many diseases
and the application of AI can improve diagnostics through
more accurate detection of pathology. Determination
of erythrocyte sedimentation parameters utilizing AI
has already been found to allow the monitoring of rare
hereditary neurodegenerative diseases and further studies
may reveal other possible clinical applications. In conclusion, ESR is by no means an obsolete test.
© 2024 West Medica. Все права защищены
Любая информация, содержащаяся на настоящем сайте, носит исключительно справочный характер, предназначена для информационных целей и ни при каких обстоятельствах не может быть расценена как предложение заключить договор (публичная оферта). West Medica не дает гарантий по поводу своевременности, точности и полноты информации на веб-сайте, а также по поводу беспрепятственного доступа к нему в любое время. Спецификация и технические характеристики продуктов, их изображение, условия приобретения, цены, спецпредложения и комплектации, указанные на сайте, приведены для примера и могут быть изменены в любое время без предварительного уведомления. Для получения более точной и подробной информации, необходимо обращаться к сотрудникам компании.